import pandas as pd
import numpy as np
import matplotlib.pyplot as plt
import seaborn as sns2 TAG definition distributions in Arabidopsis thaliana
3 Running FTAG-Finder.smk
In exp/20240501_TAG_list_size_distributions, I used FTAG-Finder.smk, git revision 0d22067.
3.1 Deployment
I used the concept of workflow module from Snakamek:
# | filename="../exp/20240501_TAG_list_size_distributions/Snakefile"

from snakemake.utils import min_version
min_version("6.0")

configfile: "config/config.yaml"

input_pep_fasta = config["input_pep_fasta"]  # proteome fasta file
run_name = config["run_name"]

module ftag_finder:
    snakefile:
        # "https://github.com/samuelortion/FTAG-Finder.smk/raw/v0.1.0/workflow/Snakefile"
        "../../subprojects/FTAG-Finder/branches/snakemake/workflow/Snakefile"
    config:
        config

use rule * from ftag_finderplt.style.use("../conf/lamme2024.mplstyle")3.2 Distribution of the number of genes in a TAG according to their definition (number of spacer)
tag_df = pd.read_csv("../exp/20240501_TAG_list_size_distributions/results/TAIR10.mcl.TAGs.tsv", sep="\t", na_values=["NA", "-"])
tag_definitions = [0,1,5,10]
tag_definitions_columns = [f"tag{i}" for i in tag_definitions]
tag_df[tag_definitions_columns] = tag_df[tag_definitions_columns].astype("Int64")
identifier_columns = ["chromosome", *tag_definitions_columns]
tag_df.head()| geneName | chromosome | strand | family | tag0 | tag1 | tag5 | tag10 | |
|---|---|---|---|---|---|---|---|---|
| 0 | AT1G01010 | Chr1 | 1 | 573 | <NA> | <NA> | <NA> | <NA> |
| 1 | AT1G01020 | Chr1 | -1 | 2487 | <NA> | <NA> | <NA> | <NA> |
| 2 | AT1G01030 | Chr1 | -1 | 844 | <NA> | <NA> | <NA> | <NA> |
| 3 | AT1G01040 | Chr1 | 1 | 845 | <NA> | <NA> | <NA> | <NA> |
| 4 | AT1G01046 | Chr1 | 1 | spacers0 | <NA> | <NA> | <NA> | <NA> |
Count how many genes are member of each TAG definition.
tag_df.groupby(identifier_columns).size().reset_index(name="count")| chromosome | tag0 | tag1 | tag5 | tag10 | count | |
|---|---|---|---|---|---|---|
| 0 | Chr1 | 1 | 1 | 2 | 2 | 2 |
| 1 | Chr1 | 2 | 2 | 3 | 3 | 2 |
| 2 | Chr1 | 3 | 3 | 4 | 4 | 3 |
| 3 | Chr1 | 4 | 4 | 5 | 5 | 2 |
| 4 | Chr1 | 5 | 5 | 6 | 6 | 2 |
| ... | ... | ... | ... | ... | ... | ... |
| 1200 | Chr5 | 268 | 295 | 316 | 333 | 3 |
| 1201 | Chr5 | 269 | 296 | 317 | 334 | 2 |
| 1202 | Chr5 | 270 | 297 | 318 | 335 | 2 |
| 1203 | Chr5 | 271 | 298 | 319 | 336 | 2 |
| 1204 | ChrC | 1 | 1 | 1 | 1 | 2 |
1205 rows × 6 columns
Number of TAG for each definition in Arabidopsis thaliana.
In the dataframe, each TAG(i) column contains identifier for the TAG with (i) spacers.
To get the number of TAGs for each definition, we simply count how many unique values are in each column.
tag_count = tag_df[identifier_columns].nunique()
tag_count
chromosome 7
tag0 316
tag1 362
tag5 408
tag10 414
dtype: int64fig, ax = plt.subplots()
sns.barplot(x=tag_count.index, y=tag_count.values, ax=ax)
ax.set(xlabel="Number of spacers", ylabel="Number of TAGs")
plt.show()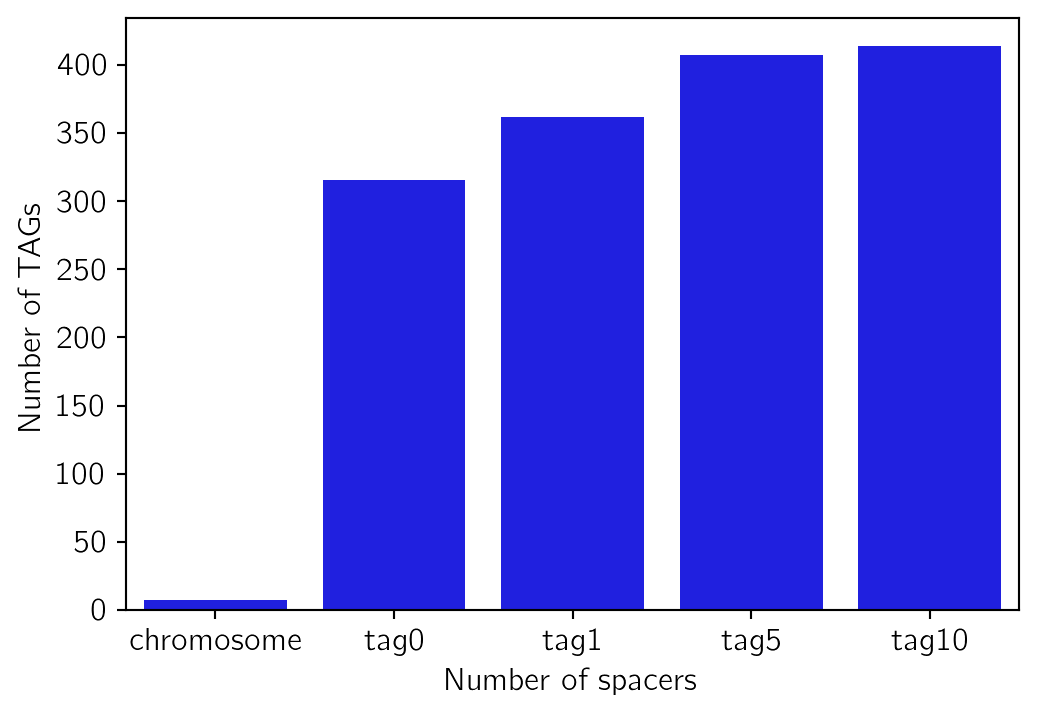
Number of genes in each TAG definition.
tag_gene_count = tag_df[tag_definitions_columns].count()
tag_gene_count
tag0 2953
tag1 3445
tag5 3842
tag10 3995
dtype: int64