library(igraph)
Attaching package: 'igraph'The following objects are masked from 'package:stats':
decompose, spectrumThe following object is masked from 'package:base':
unionlibrary(igraph)
Attaching package: 'igraph'The following objects are masked from 'package:stats':
decompose, spectrumThe following object is masked from 'package:base':
uniongraph_df <- data.frame(u=c("A", "B", "C", "A"), v=c("B", "C", "B", "C"), w=c(20, 70, 3, 100))head(graph_df) u v w
1 A B 20
2 B C 70
3 C B 3
4 A C 100G0 <- igraph::graph_from_data_frame(graph_df[, 1:2], directed=F)
E(G0)$weight <- graph_df[, 3]
G0 <- igraph::simplify(G0)plot(G0, layout=layout_with_dh, vertex.size=35, rescale=FALSE, xlim=c(-4.5, 2.5), ylim=c(-2.5, 3))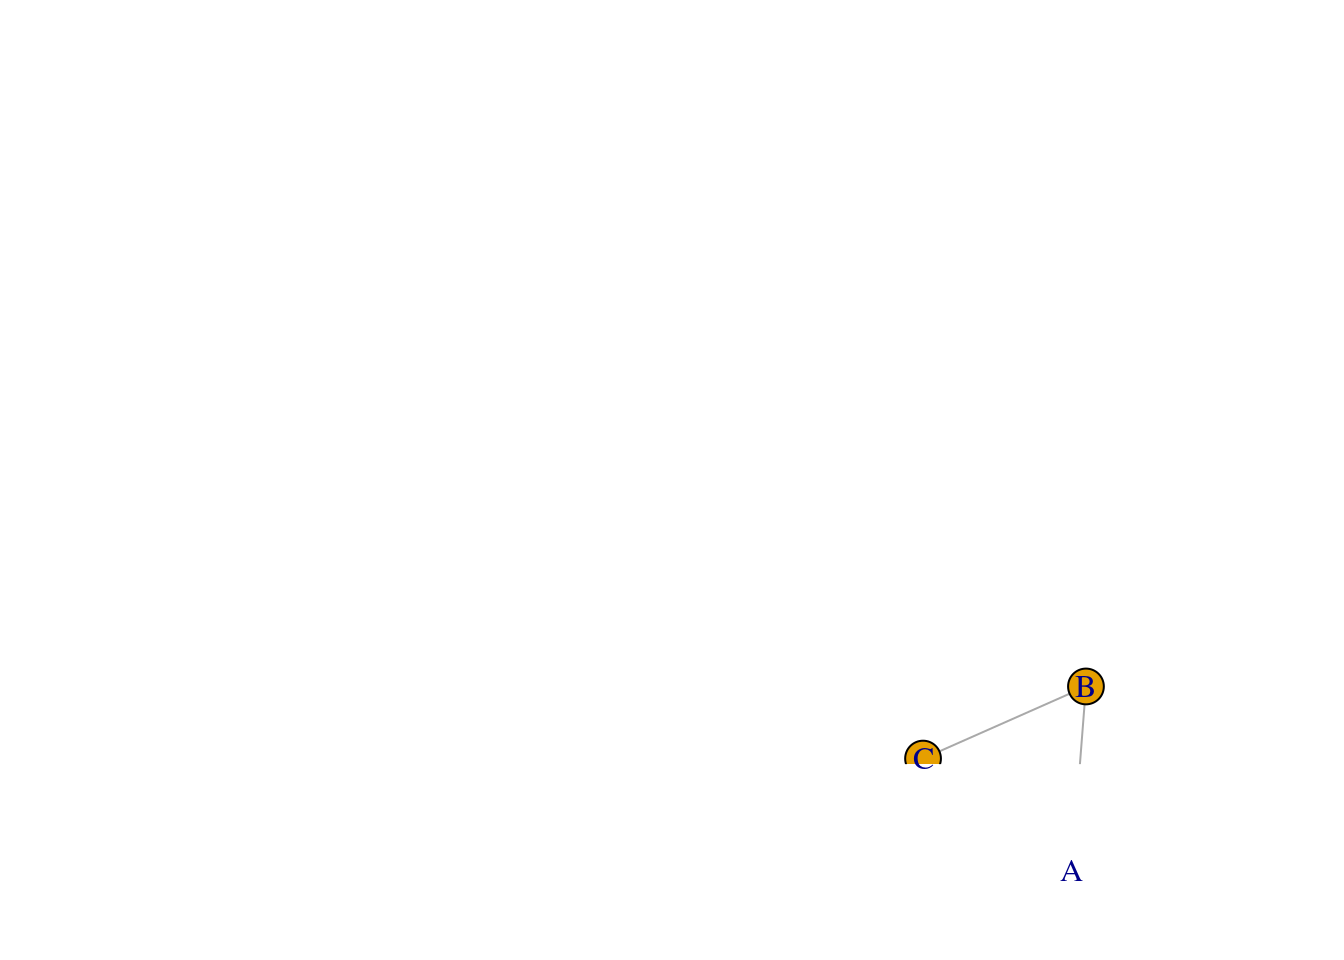
ref: <https://igraph.org/r/doigraph::graph_from_data_frame(graph_df[, 1:2], directed=F) E(G0)$weight <- graph_df[, 3]
n <- 100
p_dense <- 0.05
g_dense <- erdos.renyi.game(n, p.or.m=p_dense, type="gnp", directed=FALSE, loops=FALSE)plot(g_dense, layout=layout_nicely, vertex.size=5, rescale=TRUE)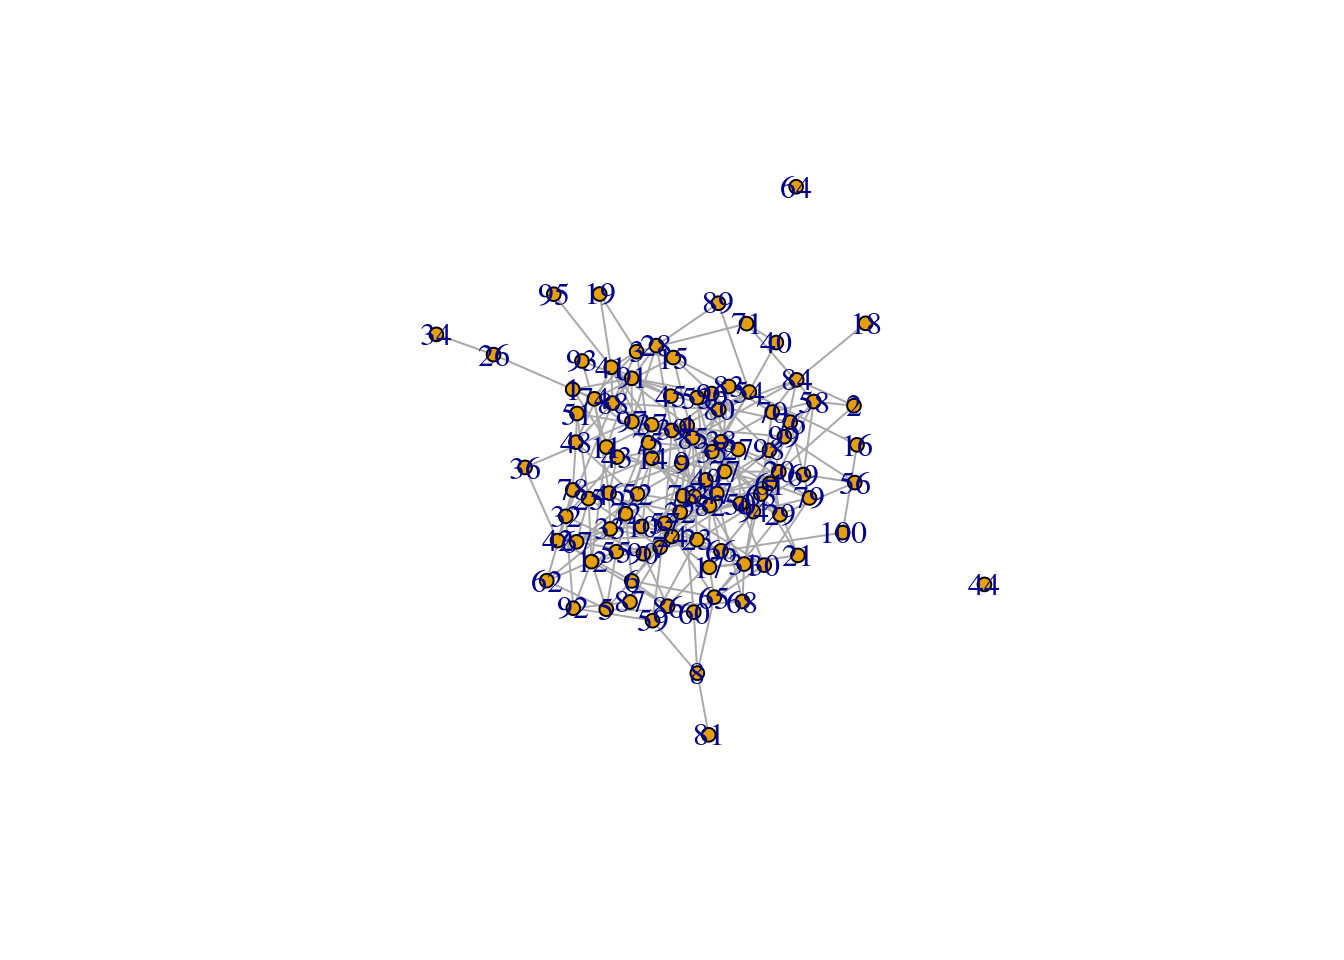
A rather less densely connected graph
p_sparse <- 0.02g_sparse <- erdos.renyi.game(n, p.or.m=p_sparse, type="gnp", directed=FALSE, loops=FALSE)plot(g_sparse, layout=layout_nicely, vertex.size=5, rescale=TRUE)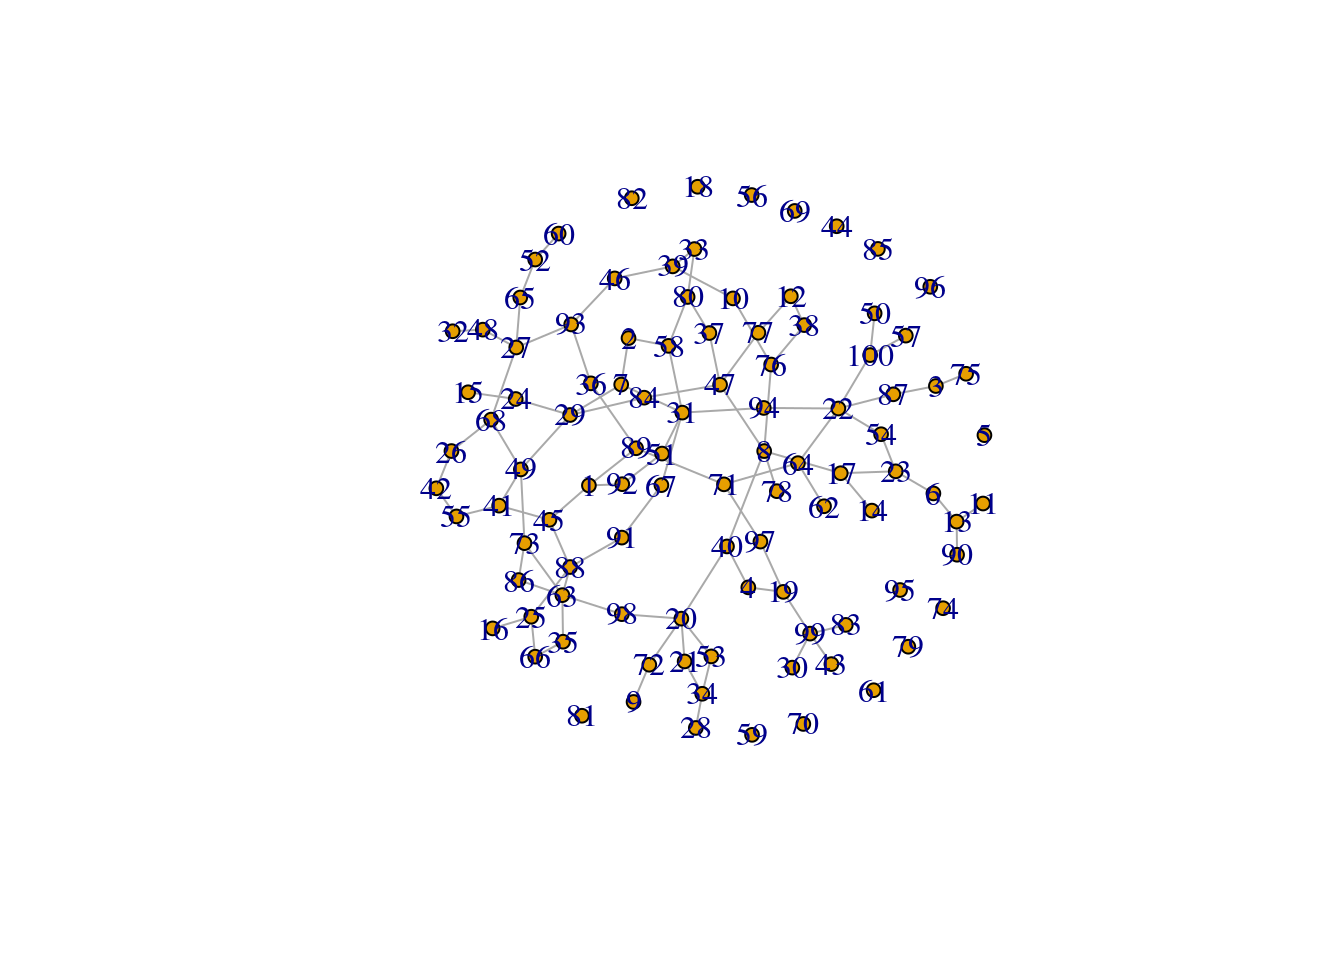
(And render pretty figures ?)
simple_communities_abc <- read.table("test/sample/simple_communities.abc")
colnames(simple_communities_abc) <- c("u", "v", "w")
head(simple_communities_abc)
u v w
1 A B 10
2 C D 10
3 D E 10
4 E F 10
5 F G 10
6 A C 10simple_communities_graph <- igraph::graph_from_data_frame(simple_communities_abc[, 1:2], directed=F)
E(simple_communities_graph)$weight <- simple_communities_abc[, 3]plot(simple_communities_graph, layout=layout_nicely, vertex.size=5, rescale=TRUE)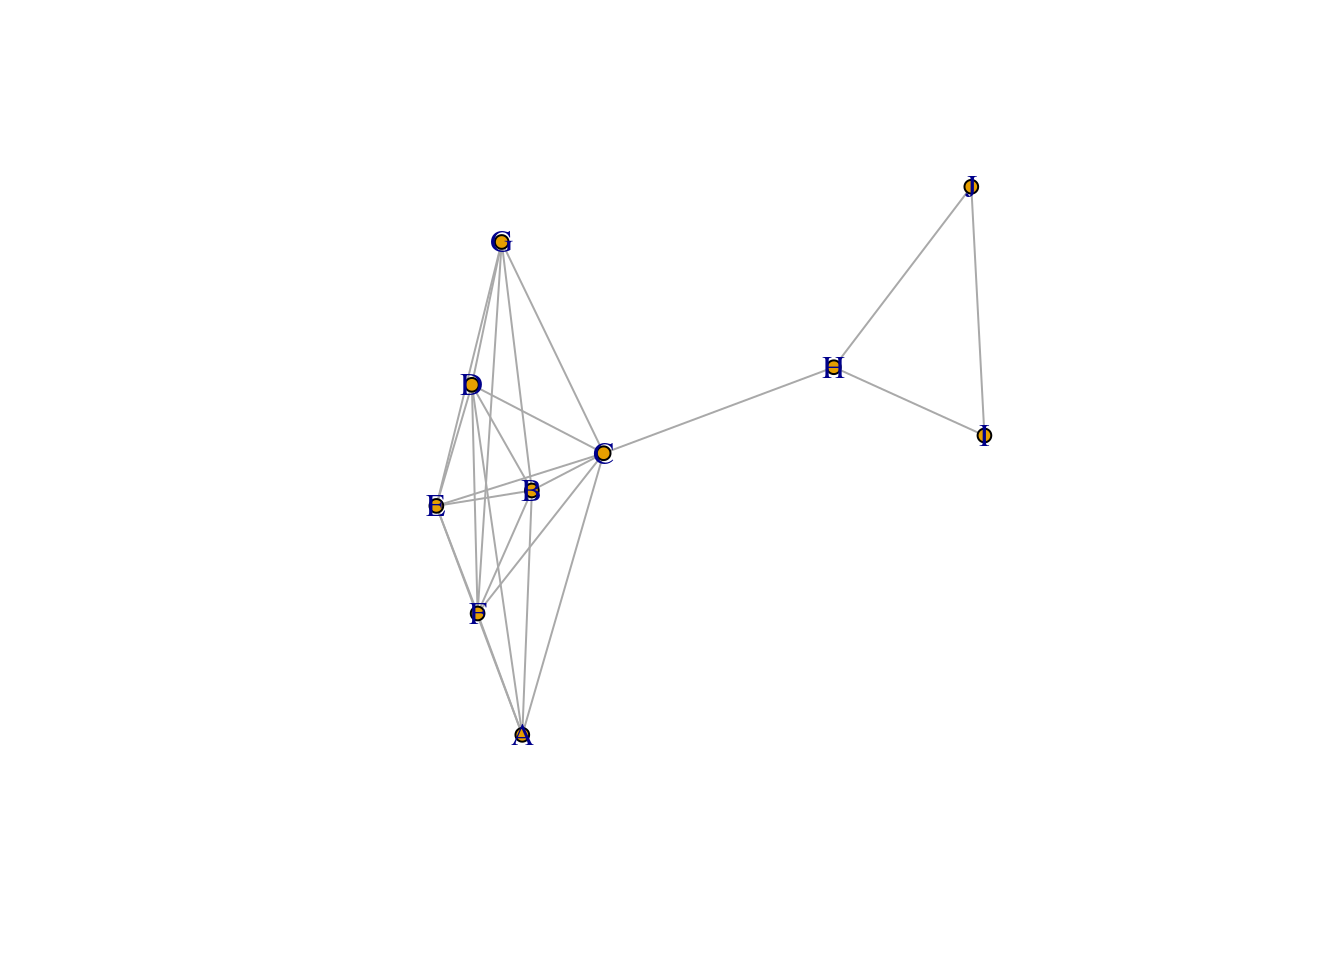
Does the Walktrap algorithm cut the \((H, I)\) edge?
communities <- cluster_walktrap(simple_communities_graph, weights = E(simple_communities_graph)$weight)communities_subtle_core_abc <- read.table("test/sample/simple_communities_with_core.abc")
colnames(communities_subtle_core_abc) <- c("u", "v", "w")
head(communities_subtle_core_abc) u v w
1 A B 10
2 C D 10
3 D E 10
4 E F 10
5 F G 10
6 A C 10communities_subtle_core_graph <- igraph::graph_from_data_frame(communities_subtle_core_abc[, 1:2], directed=F)
E(communities_subtle_core_graph)$weight <- communities_subtle_core_abc[, 3]set.seed(23)
subtle_core_layout <-layout.fruchterman.reingold(communities_subtle_core_graph)plot(communities_subtle_core_graph, layout=layout_nicely, vertex.size=5, rescale=TRUE)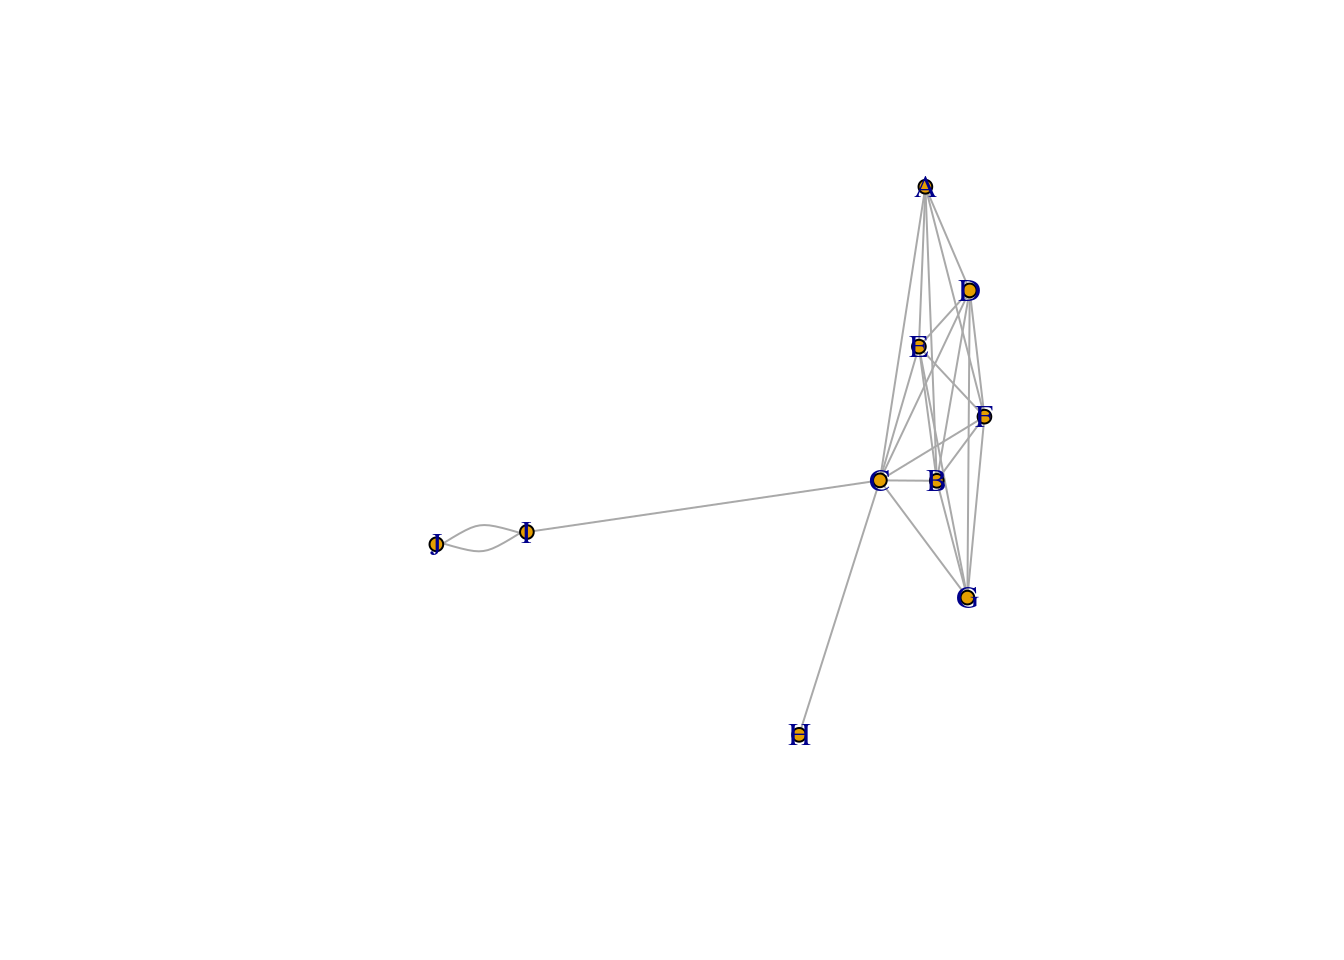
communities_subtle <- cluster_walktrap(communities_subtle_core_graph, weights = E(communities_subtle_core_graph)$weight)
par(mfrow=c(1,1))
plot(communities_subtle, communities_subtle_core_graph, layout=subtle_core_layout, vertex.label=NA, vertex.size=5,  edge.arrow.size=.2)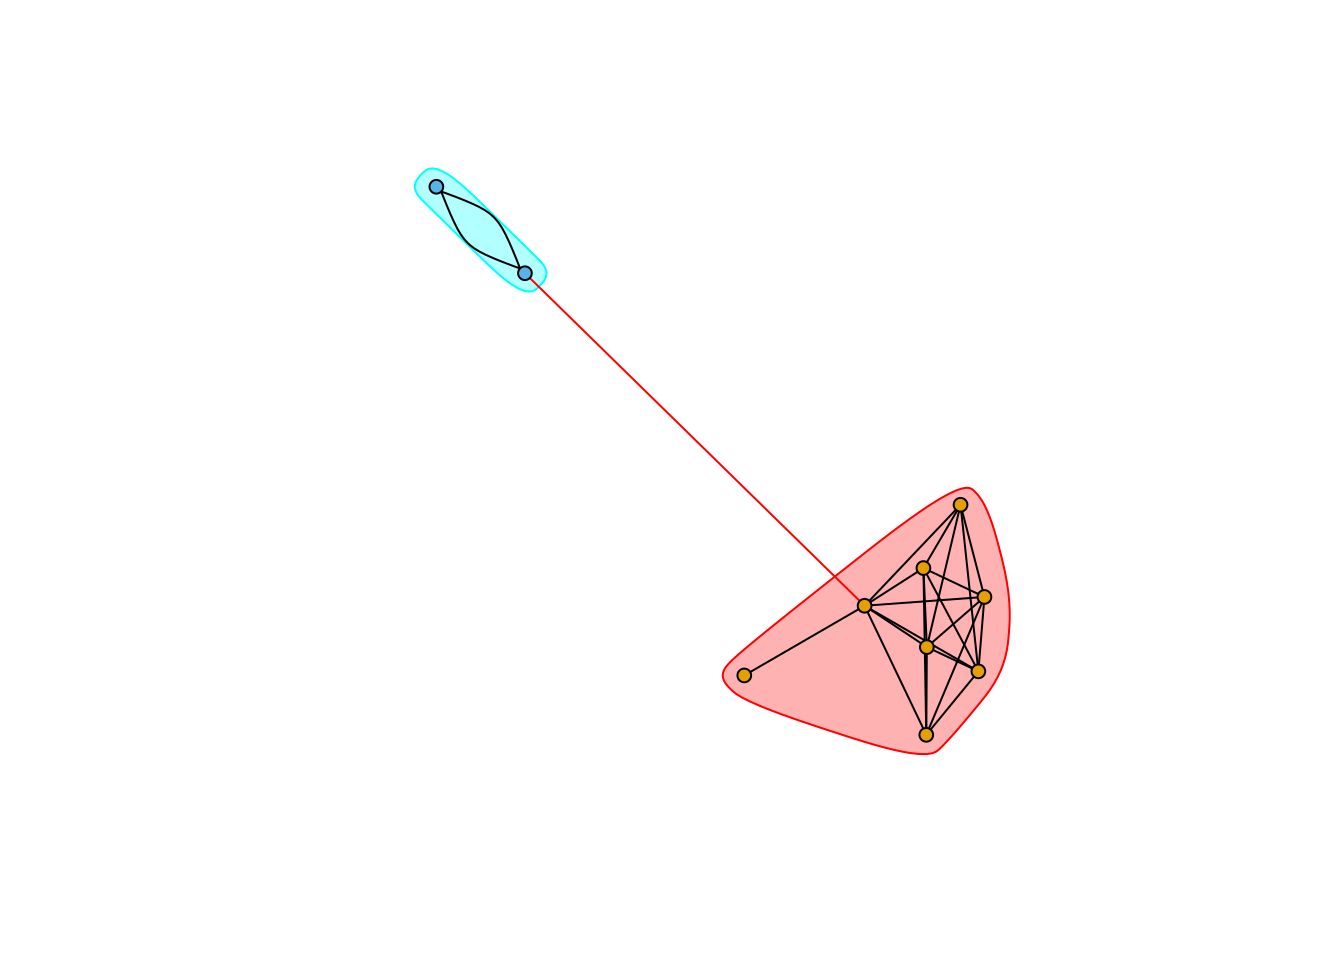
As expected the light link is cut by waltrap.
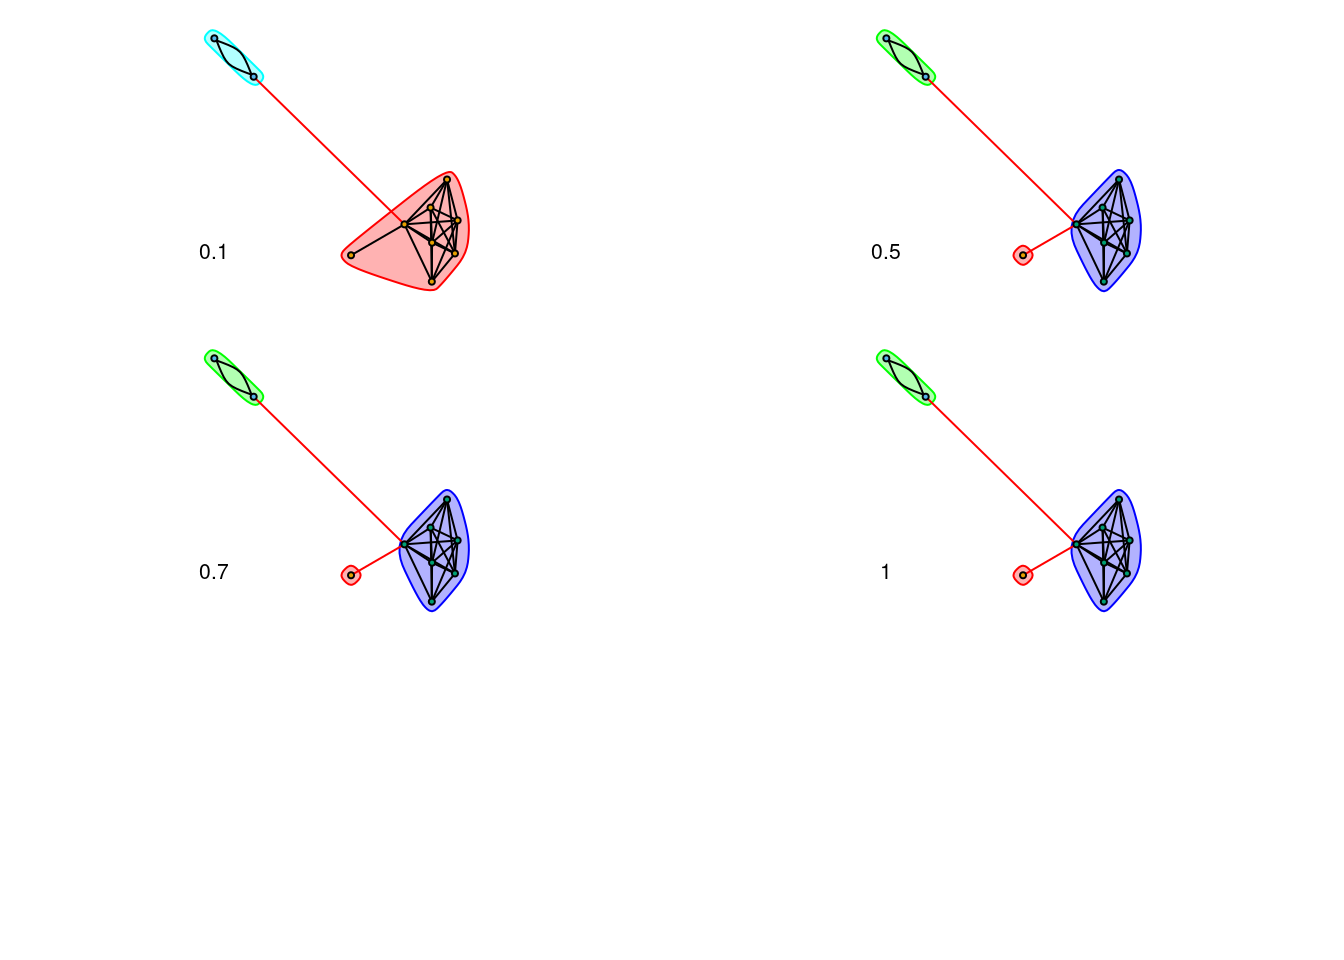
source("scripts/Walktrap-legacy/WalktrapFunctions_new-igraph.R")tested_densities <- c(0.10, 0.5, 0.7, 1)families_results <- list()
for (density in tested_densities) {
families_0 <- weightedWalktrapLinkage(communities_subtle_core_graph)
families <- familysplit(communities_subtle_core_graph, families_0, complete = 0, density = density)
families_results <- append(families_results, list(families))
}# Restore communities datastructures (we could have modified the function instead...)
communities_results <- list()
for (family in families_results) {
family_membership <- as.numeric(family[,2])
community <- make_clusters(communities_subtle_core_graph, membership=family_membership)
communities_results <- append(communities_results, list(community))
}par(mfrow=c(3, 2), mar=rep(1,4))
for (i in seq_along(tested_densities)) {
density <- tested_densities[[i]]
communities <- communities_results[[i]]
plot(communities, communities_subtle_core_graph, layout=subtle_core_layout, vertex.label=NA, vertex.size=5, edge.arrow.size=.2)
text(-1, -0.75, density)
}
ref.: https://stackoverflow.com/a/37375693/13518918
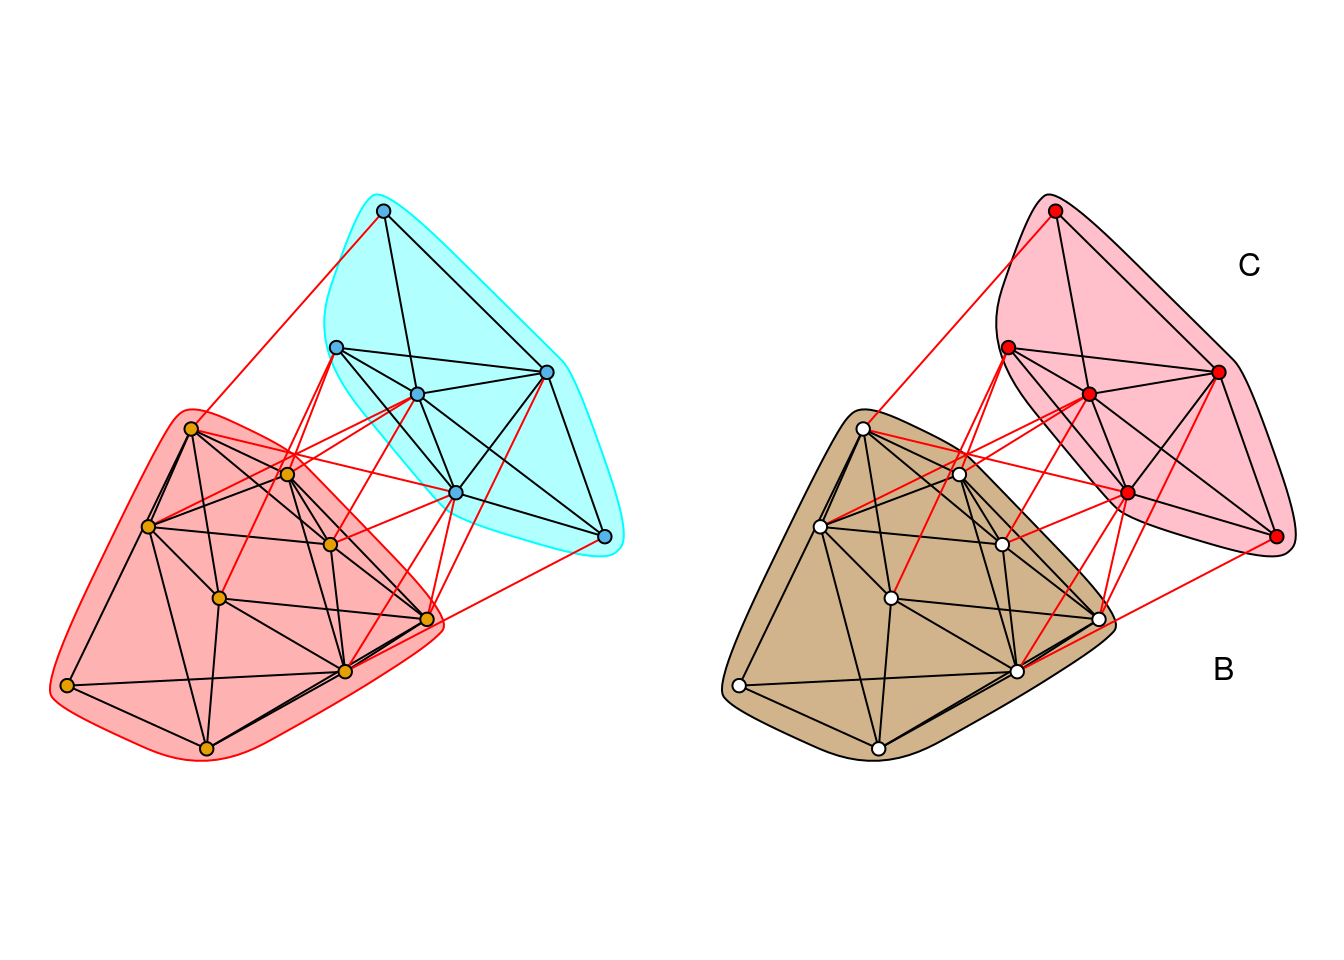
library(igraph)

# Generate random graph and community structure
g <- sample_gnm(15, 45)
wc <- cluster_walktrap(g)

# Plot
par(mfrow=c(1,2), mar=rep(1,4))
layout <-layout.fruchterman.reingold(g)
plot(wc, g, layout=layout, vertex.label=NA, vertex.size=5,  edge.arrow.size=.2)

# Change colors of nodes, polygons, and polygon borders
new_cols <- c("white", "red", "black")[membership(wc)]
plot(wc, g, col=new_cols, mark.border="black", mark.col=c("tan", "pink", "lightgray"),
    layout=layout, vertex.label=NA, vertex.size=5, edge.arrow.size=.2)

# Add labels
text(c(-1.15, 0.8, 0.9), c(0.35, -0.7, 0.8), c("A", "B", "C"))